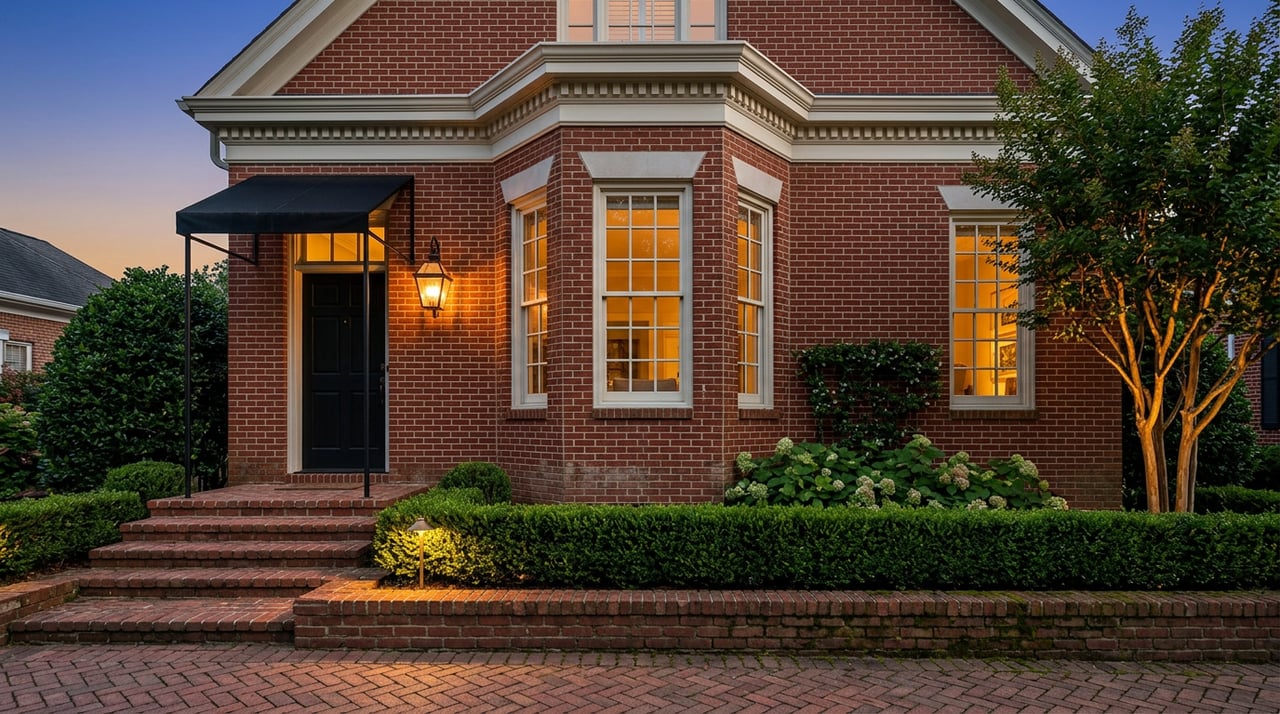
A homeowner in St. Ives Country Club calls her agent, ready to list. She has read that Johns Creek homes are taking 36 days to sell, up from 27 a year ago. Slower than last year, sure, but not alarming. She prices accordingly and waits.
A month later, a young family circling Medlock Bridge tells their agent they are in no rush. The market is cooling, they say. They can afford to wait for a price cut.
Both of them are working from the same citywide number. Both of them are wrong, in opposite directions.
The Citywide Figure Blends Two Markets, Not One
In February 2026, the most recent full-city snapshot available, Johns Creek homes sold for a median of $700,000, taking a median of 36 days to sell compared to 27 days the year before. That is the number that shows up in every market report, every agent's newsletter, every casual conversation at Newtown Park about how things are going.
It is also a blend. Johns Creek runs from townhomes under $400,000 to gated estates north of $3 million, and folding all of that into one median and one days-on-market figure erases the fact that the $700,000 to $900,000 tier and the $1.2 million-plus tier are behaving like two different cities right now. One is speeding up. The other is stalling. The citywide figure sits in the middle, telling neither story accurately.
Where the Slowdown Is Actually Concentrated
Pull the neighborhood-level data for St. Ives Country Club, covering the three months ending in May 2026, and the picture changes sharply. Homes there took a median of 55 days to sell, more than double the 21 days recorded over the same window a year earlier. The median sale price came in around $1.3 million, down 3.7 percent year over year. Only five homes sold there in May, down from nine the year before.
That is a real slowdown. It is also a market thin enough that the numbers wobble depending on exactly which 30 days you measure. A separate tracker covering roughly the same period showed St. Ives homes selling in as few as six days at a median of $1.25 million, down 28.6 percent year over year, while yet another window from the same source put the median at $1.375 million, up 5.4 percent, with price per square foot rising 4.7 percent. Three different snapshots, three different stories, all technically accurate.
That is not a data error. It is what happens when a neighborhood only trades four to ten homes in a typical month. One estate sale, one motivated seller, one all-cash buyer who skips the appraisal contingency, and the trend line for the entire community flips. Anyone pricing a St. Ives listing off a single monthly snapshot is pricing off noise. The pattern that holds across multiple windows, a slower market than a year ago with prices softening at the top, is the one worth acting on. The exact day count is not.
Where It Is Not Slowing at All
Now look at Medlock Bridge, the swim and tennis community that anchors the northeastern corridor along Peachtree Parkway. Over the same three months ending in May 2026, homes there sold in a median of 46 days, down from 67 days a year earlier. That is a market getting faster, not slower, even as the citywide headline says the opposite. The median price held at roughly $825,000, up 0.9 percent year over year, and the number of homes sold matched the prior year exactly.
Sugar Mill and Oxford Mill sit in the same general price band and pull from the same pool of move-up buyers chasing swim and tennis amenities without the country club price tag. None of the recent data on these communities shows the kind of drag that's dominating the St. Ives numbers.
The families circling this tier right now are not shopping in a slowing market. They are shopping in one where good inventory is moving faster than it did twelve months ago. Waiting for the citywide slowdown to hand them leverage is a bet against the actual neighborhood-level evidence.
| St. Ives Country Club | Medlock Bridge | |
|---|---|---|
| Median sale price (3 mo. ending May 2026) | ~$1.3M | ~$825K |
| Days on market, 2026 | 55 | 46 |
| Days on market, 2025 | 21 | 67 |
| Year-over-year price change | down 3.7% | up 0.9% |
| Direction of travel | slower | faster |
The Square-Foot Number That Flips the Intuition
Here is the detail that surprises most buyers touring both ends of Johns Creek in the same weekend. Johns Creek's blended citywide median price per square foot was $239 as of February 2026, a figure that covers everything from starter townhomes to trophy estates. St. Ives homes, several of them running past 8,000 and even 12,000 square feet with golf course frontage and guard-gated privacy, have recently traded at $180 to $220 a square foot.
That means the blended median price per square foot across the entire city, townhomes included, sits at or above what buyers are paying per square foot for some of the largest homes St. Ives has to offer. The luxury premium in that community is not primarily a per-square-foot premium. It is a premium on the lot, the golf access, the gate, and the address. A buyer comparing Medlock Bridge to St. Ives purely on cost per finished square foot may find the mid-tier home is actually the pricier one, not the mansion.
The Enclave That Sold Out While the Mansions Sat
One more data point completes the picture. Ellsworth, a gated enclave of just 24 new-construction homes on quarter-acre-plus lots built by SR Homes, has sold out completely. Every lot, every plan, gone.
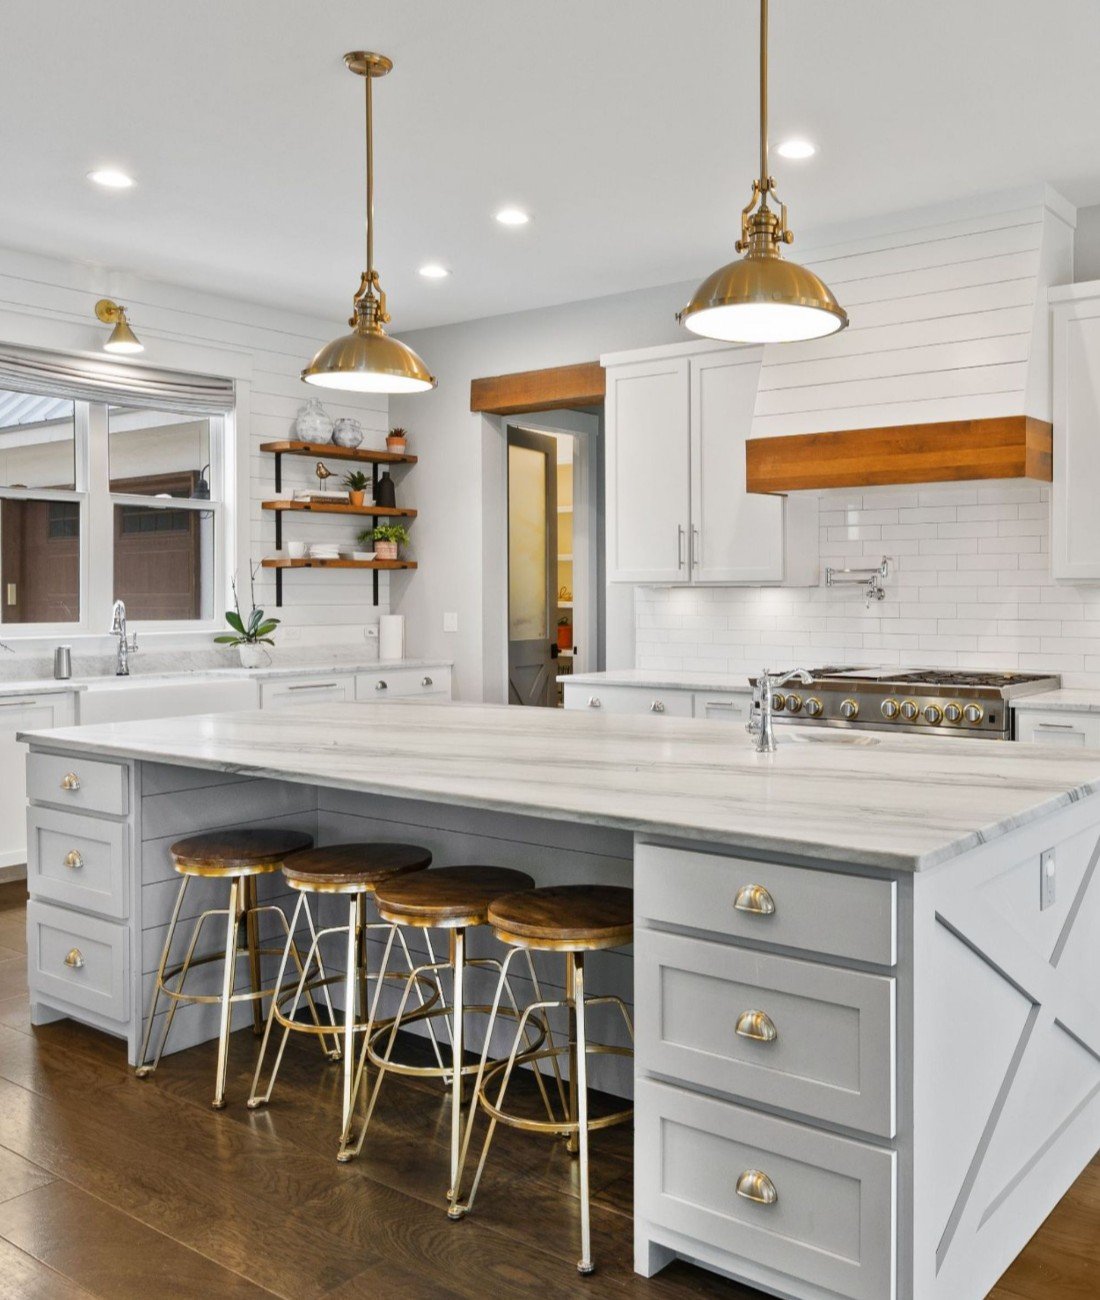
Meanwhile, resale estates in St. Ives, many built two and three decades ago with dated kitchens and baths, are sitting for months at a time. The demand for luxury in Johns Creek right now is not evenly distributed across the price tier. It is concentrated in small, new, turnkey product, and it is thinning out for large, older homes that require a buyer to see past the 1990s finishes to the bones underneath.
For a seller sitting on one of those legacy estates, that is not a reason to panic. It is a reason to close the gap between what the house looks like today and what a buyer touring a sold-out new-construction enclave has come to expect. Professional staging and a clear-eyed pre-listing update plan do real work in exactly this situation, narrowing the distance between a dated showing and a move-in-ready one without the cost of a full renovation.
What This Means If You're Buying or Selling in Johns Creek
- If you're selling above $1.2 million, price off the trend across several months of St. Ives-specific data, not a single 30-day snapshot and not the citywide 36-day figure. The luxury tier is genuinely slower than a year ago, and your timeline should reflect that.
- If you're buying in the $700,000 to $900,000 range around Medlock Bridge, Sugar Mill, or Oxford Mill, do not wait for a citywide slowdown to hand you negotiating room. The data for that tier is moving the other way.
- If you own an older estate-style home, expect to compete directly with sold-out new-construction enclaves like Ellsworth for the same pool of luxury buyers. Staging and targeted updates matter more here than they did when inventory was tighter across the board.
- If you're comparing two homes on price per square foot alone, check which tier each one sits in first. A lower price per square foot on a golf course estate does not automatically mean a better deal once lot size, amenities, and carrying costs enter the picture.
A Few Questions Worth Asking Before You Act
Is the entire Johns Creek market cooling down? Not evenly. The citywide days-on-market figure is up, but that increase is being driven by the slowdown at the top of the market. Mid-tier communities like Medlock Bridge are moving faster than they were a year ago.
Why do different sources show such different numbers for the same neighborhood? Luxury communities like St. Ives trade very few homes each month, sometimes fewer than ten. A small sample size means the median price and days-on-market figure can swing widely depending on the exact window measured. Look for a pattern across several months rather than trusting any single 30-day snapshot.
Does this mean now is a bad time to sell in St. Ives? It means timeline expectations should be set using St. Ives-specific data, not the citywide average. Homes are taking longer to sell there than they were last year, which affects how a listing should be priced and marketed, not whether it should be listed at all.
If you're weighing a move in Johns Creek and want a read on how your specific street or price tier is actually behaving, Pamela Bills can walk you through the current data for your neighborhood and put together a plan built around what's really happening there, not the citywide average. Schedule a free consultation to get started.