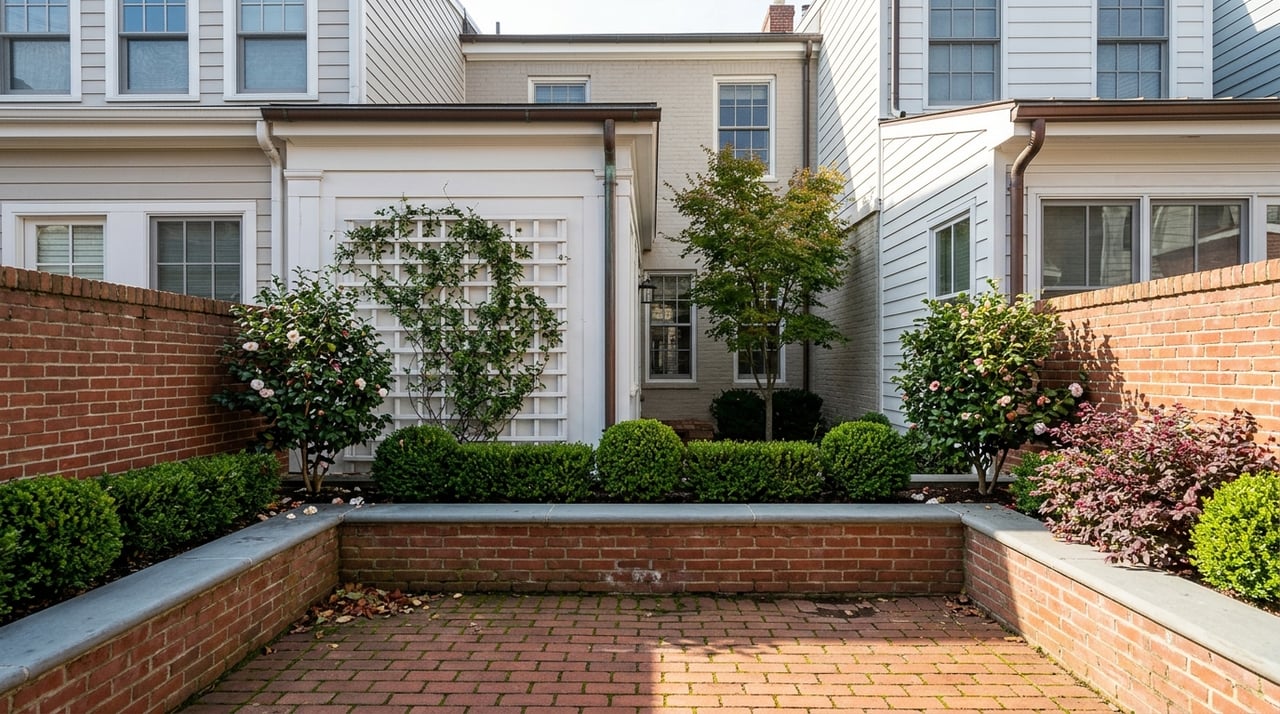
Walk down Mimosa Boulevard on a Saturday morning and you pass homes built before the Civil War standing shoulder to shoulder with a small cluster of townhomes and single-family houses that didn't exist a decade ago. That cluster is worth pausing on. For roughly 75 years before it broke ground, nobody built anything new on that street. When Reminisce Residential and Stonecrest Homes finally added four townhomes and three custom houses to a parcel one block off Canton Street, the project was described at the time as likely the last new construction Mimosa would see for another 75 years.
That long pause in construction helps explain what you'll pay per square foot in the Historic District better than any renovation, view, or floor plan will. If you're comparing that pocket of Roswell to Horseshoe Bend, Martin's Landing, or anywhere with a normal supply pipeline, the comparison itself needs a different frame before the numbers make sense.
If you want the broader Roswell picture before zooming into this one pocket, our Roswell neighborhood guide covers the market as a whole.
Two Different Market Readings
Pull two market trackers for the same 120-acre district and you get two different stories. One snapshot, covering the month through May 2025, put the Historic District's median sale price at $675,000, up 15.4% year over year, with a median of $311 per square foot. A separate trailing 12-month reading tells something closer to the opposite: a median of $625,000 through December 2025, sliding to $615,000 by January 2026, both readings down 13 to 17% from the prior 12-month period.
| Source and window | Historic District median sale price | Year-over-year direction |
|---|---|---|
| Month through May 2025 | $675,000 | Up 15.4% |
| Trailing 12 months through Dec. 2025 | $625,000 (avg. $656,430) | Down about 13% |
| Trailing 12 months through Jan. 2026 | $615,000 (avg. $662,791) | Down about 17% |
Both readings are pulling from the same MLS data. Neither is wrong. They're measuring a district where roughly 20 to 25 homes change hands in an average month, spread across only about 120 acres. When your entire dataset for the month is two dozen closings, one large estate sale or a run of modest townhome resales can swing the median double digits in either direction. Citywide, Roswell sold 87 homes in February 2026 alone at a $645,000 median and $239 per square foot, a pool large enough that the number holds steady from month to month. The Historic District's number never does.
How Historic-Preservation Review Shapes the Price Tag
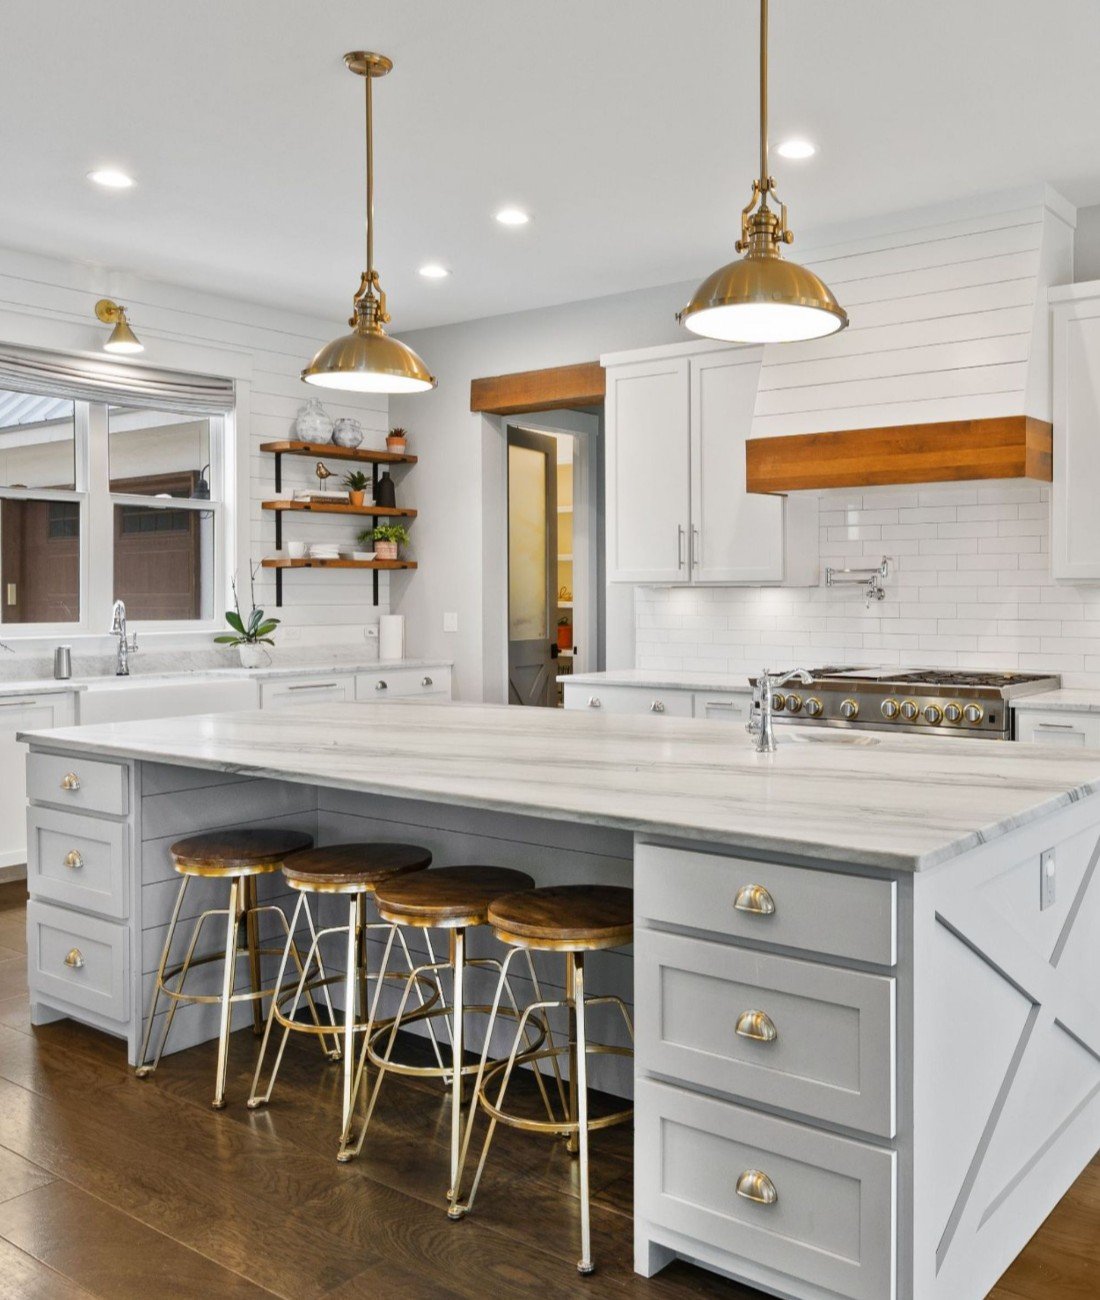
Here's what the monthly swings obscure: even on the lower, softer reading, the Historic District still runs close to the citywide median while delivering less house. Buyers researching the district consistently find smaller, more clearly defined rooms, narrower hallways, and cozier kitchens compared to newer construction elsewhere in Roswell, along with the added step of getting exterior changes cleared by the city before touching a window, a roofline, or a fence.
That review authority is not a formality. The city's Historic Preservation Commission holds jurisdiction over new buildings, exterior architectural changes, demolition, moving structures, and changes to exterior environmental features anywhere inside the boundary the National Register of Historic Places recognized in 1974, a roughly 120-acre area bounded by Big Creek, King and Dam Streets, and New Marietta Highway. Structures inside it date as far back as 1837. New construction inside it is subject to Commission review.
That's part of the picture behind the per-square-foot premium. It isn't just buying finishes or floor area. It's buying a lot inside the historic boundary, subject to the city's historic-preservation review.
The review process still allows occasional new construction. As of January 2026, listings inside the district still occasionally include genuine new construction, including a custom home from Tipton Homebuilders on a quiet downtown street and a new build in the Roswell Mill area backing directly onto Vickery Creek. Those listings exist because they're rare. Each one gets marketed as an event rather than folded quietly into the regular inventory, which is itself evidence of how thin the pipeline runs.
Where the New Supply Actually Lands
Roswell isn't short on construction. It's short on construction inside the historic boundary. The growth is landing just outside it, on parcels the Historic Preservation Commission has no authority over.
The most visible example is the Hill Street Mixed-Use Development, moving forward under a Scope of Work agreement with the city's Downtown Development Authority and governed by the newly created Hill Street Overlay District, a zoning framework covering properties along Hill Street, Oak Street, Ellis Street, and Forrest Street. Site preparation began in late 2025 and early 2026, with certificates of occupancy expected around November 2027. A few blocks away, Southern Post, built on the site of a former strip shopping center, has already leased up as a mixed office, retail, and residential project, and The Chambray, a 125-room boutique hotel next door, broke ground in February 2026 targeting a summer 2027 opening.
None of that supply sits inside the 120-acre historic boundary. It sits adjacent to it, close enough to benefit from Canton Street foot traffic and the district's reputation, but outside its review process. Together, these projects show where Roswell's current growth is concentrated.
Three Metrics That Hold Up Better Than the Median
If you're comparing a Historic District listing to something in Horseshoe Bend or Martin's Landing, the headline median is close to useless on its own. Three numbers do more work.
- Price per square foot across several quarters, not one month. A single month's median in a 20-home market can be moved by one unusual sale. A multi-quarter trend in price per square foot filters out that noise and shows the actual direction.
- Days on market by pocket, not by city. In March 2026, a neighborhood-level breakdown showed median days on market ranging from 23 in Martin's Landing to 30 in the Historic District to 48 in Holcombs Crossing, all inside the same city limits. A citywide average of 47 days tells you almost nothing about how fast a specific street is moving.
- How many truly comparable sales exist in the trailing 12 months. Historic homes with unique layouts or period features can run into real appraisal friction when there simply aren't enough similar recent sales to anchor a valuation. Ask for that comp count before you get attached to a number.
What This Means If You're Weighing a Purchase Here
None of this argues against buying in the Historic District. It argues for pricing it correctly. You are not just buying square footage at a premium. You are buying a position inside a boundary that has remained in place, with new density like Hill Street and Southern Post located at the district's edges rather than its interior.
That scarcity cuts both ways if you're the one selling. With only two dozen closings a month setting the comps for the entire district, how a single listing is presented carries more weight than it would in a higher-volume subdivision. A home that photographs and shows well doesn't just compete against three other active listings. For a stretch of weeks, it may be the comp everyone else in the pocket gets measured against.
If you're trying to figure out what a specific Roswell property is actually worth once the noise in the monthly medians is stripped out, or you're preparing a Historic District home to be that comp rather than chase one, Pamela Bills has spent nearly a decade pairing design-forward staging with North Atlanta market data to get both sides of that equation right. Schedule a free consultation and we'll walk the specific pocket, not just the citywide number, before you write an offer or set a list price.
A Couple of Questions Worth Asking Before You Compare Comps
Does the Historic Preservation Commission ever approve brand-new construction? Occasionally, on non-contributing lots or after a teardown, but the approvals are rare enough that each new build gets marketed as a standalone event rather than folded quietly into the district's regular inventory.
Why do the citywide numbers move so much more smoothly than the district's? Volume. Roswell as a whole sold 87 homes in February 2026 alone, a sample large enough that the median barely shifts month to month. The Historic District's monthly sample is roughly a quarter of that size, so a handful of unusual closings can swing its median far more than the underlying market actually moved.
This article is general information, not legal, tax or financial advice. Consult a qualified professional about your situation.